Effets de Nosema ceranae sur la maturation comportementale des abeilles
Experimental infection
Fresh spores were isolated and purified from naturally-infected foragers from a colony located at the National Institute of Agricultural Research (INRA) from Avignon (France) according to the protocol adapted from Higes et al. (2007). Briefly, bees were kept in the cold for 20 min to anesthetize them, abdomens were separated with dissection tweezers, homogenized in distilled water, filtered in Whatman N°4 paper and then centrifuged three times (6 min at 800 g), the supernatant was discarded as the spores remained in the sediment. The pellet was suspended in 10 ml of distilled water and the spore concentration was calculated using a haemocytometer. This suspension was used to prepare a dose of 100 000 spores per bee in a 50% sucrose solution. In laboratory experiments a similar spore dose produced less than 10% of bee mortality in 10 days and 50% in 20 days (Vidau et al., 2011). Newly emerged honey bees were fed individually with 2 µl of this solution using a micropipette. After infection honey bees were colored marked and introduced into a small hive. Nosema species was confirmed by PCR as described in Alaux et al. (2010). To obtain new born honey bees for infection, frames of capped brood were collected one day before emergence from 3 different colonies and kept in incubators (33°C). New born bees were mixed in order to reduce a potential colony effect. Samples of new born bees used to build cohorts were analyzed to verify absence of N. ceranae spores. Bees were divided in two cohorts, one non-infected bees (control) and one to be infected with N. ceranae spores as described before.
Experimental colonies
The effect of N. ceranae was tested in colonies made of four different cohorts of worker bees introduced in a small hive or nucleus (“nuc”) (Fig. 1). A total of three identical nucs were used in parallel. Each nuc contained cohorts of both non-infected bees and N. ceranae infected bees which allowed comparing the behavior and pheromone profile between both groups sharing the same environment. The nucs were built as follow:
Day 0- introduction of the first two cohorts
On day 0 of the experiment, each nuc was built with two cohorts composed of new born honey bees. One cohort named “Control 1” was composed of 4000 N. ceranae-free bees and a second cohort named “Nosema 1” corresponded to 300 N. ceranae infected bees. “Control 1” cohort played the role of “background bees” of the nuc representing the main population in the colony.
Day 7- introduction of the second two cohorts
Seven days after nucs were built, two other identically treated cohorts of new born honey bees were introduced in the same nuc. One cohort named “Control 2” of 300 N. ceranae-free bees and a second cohort named “Nosema 2” of 300 N. ceranae infected bees. To populate the nucs, frames of sealed brood were kept in an incubator at 34ºC ± 1ºC, when new worker bees started to emerge they were carefully removed, marked with a paint dot on the thorax, with each cohort a separate color and placed in the nuc. In the case of Nosema treatedbees, they were infected, marked and then introduced in the nuc. All nucs had the same number of bees and contained two honeycomb frames and two empty frames. To simulate the presence of a queen, each nuc was given a commercially available plastic strip (Bee Boost, PheroTech, Delta, BC, Canada) containing the five components of the Queen Mandibular Pheromone (QMP) blend that releases one queen equivalent per day. Because no brood was produced, colonies had no exposure to brood pheromone. Controlling both QMP and brood pheromone is important as they can affect the age of onset of foraging (Leoncini et al., 2004). The last day of the experiment the entrance of the nucs were closed during the evening and live remaining bees were froze at -20°C to be counted and calculate bee mortality
Optic bee counter and flight activity
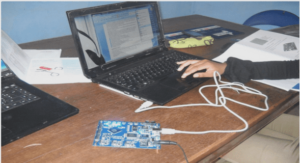
The three nucs were equipped with an optic-electronic bee counter at the entrance that allows for the recording of outgoing (exits) and incoming (entrances) bees between the nest and the field. The count was recorded every 5 min (i.e. cumulated activity during 5 min) for 24 h a day, yielding 288 measurements per day of both “in” and “out” with no limits on days of registration. Date, time and cumulative values were automatically saved in an Excel file. In this way it is possible to introduce 4 cohorts in a nuc to be counted independently, 3 cohorts marked with 3 different colors and one cohort non-marked. Nonstop recording is highly important when studying forage behavior in bees since flight patterns are the result of the interaction of weather and other environmental factors. Indeed in some natural landscapes foraging patterns can suffer daily changes as new and better food sources are discovered (Winston, 1987), so a limited time of observations per day can give only a partial idea of flight activity. The optic counter consists of a camera placed inside of a modified entrance of a nuc. At the bottom of the entrance there are 8 passages with the form of a tunnel with the size of one bee that can be crossed only while exposing the back of the thorax to the camera. The width of the 8 passages corresponds to the camera lens angle. An original software (IDDN. FR.001.130013.000.R.P.2010.000.31235) developed in the laboratory at INRA – Avignon, which runs in LabView environment for graphic programming, allows to calibrate the sensibility to different colors to achieve the highest performance when counting bees with a minimal error (3 – 4 %). It also adjusts the frequency of images captured per second in order to reduce the chance of missing some bees passing in front of the camera. The software controls the three cameras (one in each of the 3 nucs) simultaneously, processes the signal, analyzes the images in real time and acquires the data.
Ethyl oleate chemical analysis
Twelve incoming honey bees were sampled from each cohort of infected and control bees at the entrance of the nucs. They were picked by the thorax with a pair of soft tweezers and immediately froze and stored at -20°C until analysis. Sampling was carried out when bees were 14 and 21- days-old. Pools of 4 bees were analyzed for EO quantification as described in Dussaubat et al. (2010). Briefly, whole-body extracts were prepared in iso-hexane with the addition of two internal standard solutions (methyl eicosanoate and methyl heptadecanoate, Sigma-Aldrich, France). After samples were crushed and centrifuged, supernatant was applied to a silica column and two fractions were obtained, the second fraction containing fatty acid methyl esters including EO was concentrated under a nitrogen stream, and 1 μl injected into a gas chromatograph (GC, 2014, Shimadzu, Japan) equipped with a flame ionization detector (FID), and a capillary column Omegawax 100 (10 m x 0.10 mm, 0.10 μm film thickness). Identification and quantification of EO was based on retention times of EO synthetic compound (Sigma-Aldrich, France) and by comparison of internal standard area, respectively. The EO confirmation was done by a GC-MS (Trace-ISQ, Thermo Scientific, USA), operated in the electron impact mode at 70 eV, continuous scans (m/z 50 – 500), equipped with a capillary column TR5-MS (20 m x 0.10 mm, 0.10 µm film thickness).

