Cours Descriptive Statistics – involving one variable, tutoriel & guide de travaux pratiques en pdf.
Descriptive Statistics – involving one variable
The first step at the beginning of analysis is to run descriptive statistics (e.g. counts, averages, maximum, minimum, and standard deviations) for all variables. This type of analysis helps you to find data entry errors, to give you a « feel » for what your data are like, and to be sure that missing values have been defined correctly, etc. It may be tempting to skip this step for some data sets or for some variables, but this is an important step that will almost always save you time later and improve your analysis. For example, finding out the average age of all respondents may not be something you are interested in knowing, but if the average age turns out to be 91.3 yrs, you would be alerted that something is probably wrong.
Basic descriptive statistics can be obtained from two common SPSS for Windows commands—Descriptives and Frequencies. Descriptives is used for continuous (scale) variables, while Frequencies is used for categorical (nominal and ordinal) variables.
Continuous / categorical variables definition
A continuous variable is a variable that does not have a fixed number of values. A categorical variable is a variable that has a limited number of values that form categories. For example, look at Annex 2, Table IA:
Household Member questionnaire. Variable ca3 (age) is a continuous variable because age can take on many different values. Variable ca2 (relation to head) is a categorical variable because its values are limited to the categories 1-6.
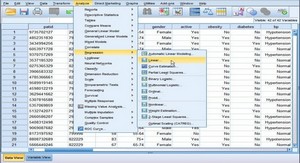
Scrolling through the data will give you a « feel » for what is in the data file. It might also help point out obvious errors, e.g. a variable whose values are missing for all listed cases. Decide which of the variables are continuous and which are categorical (normally you would refer to the questionnaire to make this decision). You need to know this in order to select the right procedure to use for each variable. If you mistakenly perform a Frequencies on a continuous variable, you will probably get more output than you really want, with possibly hundreds of different « categories », one for each different value found. If you perform a Descriptives on a categorical variable, you will usually get meaningless results, since the average value of a variable that consists of categories may have no real significance.
Descriptives
By examining the data, you should have found that variable ca3 (age) is continuous (or scale) and the remaining variables are categorical. To run descriptives on ca3, do the following:
From the Analyze menu, select Descriptive Statistics….Descriptives
Save the Output File
that output file. Switch to the Viewer window. Click on the File…Save as… on the SPSS toolbar at the top right. In the “File Name” box, type Session1 – make sure that the directory is the one where you want save the output. SPSS will automatically add the extension .SPO to indicate an output file.
Frequencies
Since the variables ca1 (work on a farm or not), ca2 (relation to head), ca4 (sex), ca5 (level of schooling) and ca6 (marital status) are categorical, we will run a Frequencies on those variables. To run frequencies, do the following:
- ..Descriptive Statistics…select Frequencies ... The Frequencies dialog box will open.
- Click the Reset button to clear the Variables box.
- Select ca1 from the list on the left and click on the ca1 will move to the Variable(s): box on the right
- Repeat step 3 until ca2, ca4, ca5 and ca6 have all been moved to the Variable(s):
- Click on Paste to put the command into the Syntax Editor and switch to the Syntax window to make it active.
- Execute the command by clicking on the Run button located on the Toolbar.
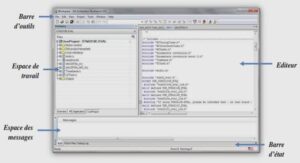
SECTION 0 – File structure for SPSS 15 for Windows
File Types Used in SPSS.
The Syntax Editor.
The Data Editor
The Viewer
Summary of the Basic File Types
SECTION 1 – Basic functions: SPSS files, Descriptives and Data Transformations
Introduction
Data Files and the Working File.
Utilities / Variables
DISPLAY DICTIONARY command.
Descriptive Statistics – involving one variable
Continuous / categorical variables definition
Descriptives
Save the Output File
Frequencies.
Save the Syntax File
Exercise
Descriptive Statistics – involving two or more variables
Crosstabs
Means
Data Transformations
SECTION 2 – Restructuring Data Files – Table Lookup & Aggregation
Introduction
Step 1: Generate a household level file containing the number of calories produced per household.
Merge files –file-table lookup merge.
COMPUTE command
SELECT IF command
AGGREGATE command
Step 2: Generate a household level file containing the number of adult equivalents per household
COMPUTE / IF command
Recode into the Same Variable
AGGREGATE command
Step 3: We need to join the two files created in steps 1 & 2 together in order to compute calories produced
per adult equivalen Merge files –file-file merge
SECTION 3 – Tables & Multiple Response Questions
TABLES
CROSSTABS vs. TABLES
BASIC TABLES
GENERAL TABLES
Compare Means vs. TABLES
Exercise
Multiple Response
Analyze / Multiple Response command
Category variables
SPSS 15 for Windows 4 February 2007
Analyze / Multiple Response / Crosstabs.
Multiple Dichotomy Variables
Multiple Response TABLES.
SECTION 4 – Graphs, tables, publications and presentations
Copy table output to a word processor.
Copy graphics to a word processor
GRAPH command
IGRAPH command
CHART BUILDER: GGRAPH command
CHARACTERISTICS