COUPLAGE FERMENTATION / ELECTROLYSE
MICROBIENNE
INTRODUCTION
Hydrogen (H2) as energy carrier is of increasing interest. It is a promising clean and sustainable energy carrier. This is due to its high energy density and its high efficiency as fuel cells for conversion of H2 to electricity for transportation purpose (Hawkes et al., 2007; Hallenbeck and Ghosh, 2009; Guo et al., 2010). Nowadays, hydrogen is mostly produced by natural gas reforming which causes twice carbon dioxide equivalent compared to biohydrogen and contributes to carbon depletion (Das and Veziroglu, 2001; Hajjaji et al., 2013). However, recent developments in the field of biotechnologies and sustainable development led to a renewed interest in alternative technologies to produce hydrogen from different biomass sources such as dark fermentation and, more recently, microbial electrolysis (Hallenbeck and Benemann, 2002; Logan et al., 2008; Gómez et al., 2011). The past decades have seen increasing and rapid advances in the field of microbial electrolysis cells (MEC) development. A MEC is a process that permits to convert organic matter into hydrogen. It consists in an anode on which organic substrates are microbiologically oxidized with a release of electrons associated with a cathode that uses the Exogenous microorganisms input Chapitre V : Couplage fermentation / MEC 198 generated electrons to produce hydrogen following the electrochemical reduction of water (Logan et al., 2008; Liu et al., 2010). In MECs, the oxidation process is achievable because of the development on the anode of a bacterial biofilm which catalyses organic matter oxidation. This electroactive biofilm contains electroactive bacteria, also named anode respiring bacteria (ARB), that have the ability to transfer electrons released from organic matter oxidation to an insoluble and external electron acceptor, e.g. the anode. In comparison to hydrogen production with strictly electrochemical process of water electrolysis, MEC requires 5 to 10 less energy input, decreasing the energetic cost of so produced hydrogen (Liu et al., 2010). Although microbial characterisation of several microbial BESs already showed the predominance of Geobacter sulfurreducens in electroactive biofilms, (Holmes, Bond, O’Neil, et al., 2004; Badalamenti et al., 2013), analysis of the microbial diversity of enriched anodic biofilms revealed that different microorganisms might be responsible for the observed electroactivity. However, these analyses did not reveal any tendency in dominant members within the biofilm communities. An example of such microbial diversity is shown by the ARBs usually found associated to either α, β, γ, δ-Proteobacteria, Firmicutes, Acidobacteria or Actinobacteria (Liu et al., 2010). Biohydrogen production process by dark fermentation pathways in mixed cultures allows the conversion of hexose (saccharose, glucose) with limited conversion rate (2-3 moles of hydrogen per mole of hexose) and with the concomitant production of organic metabolites (mainly acetic and butyric acids) (Hawkes et al., 2007; Guo et al., 2010). Fed with acetate, a MEC produces up to 3 moles of hydrogen per mole of acetate (Liu et al., 2010; Gómez et al., 2011). The association of dark fermentation and MEC process could theoretically lead to the production from 8 to 9 moles of hydrogen per mole of hexose, which is close to the maximum theoretical potential hydrogen yield of 12 moles of hydrogen per mole of hexose. However, environmental conditions are rather different between dark fermentation (low pH in a range of 5-6, 37°C) and MEC (neutral or alkaline pH, high conductivity). Nevertheless, previous studies showed the feasibility of dark fermentation at pH 8 under saline conditions (35gNaCl/L) in mixed culture (Pierra et al., 2013). While many species belonging to Clostridium, Enterobacter and Escherichia genera have been described in the literature as hydrogen-producing bacteria in mixed cultures (Hawkes et al., 2007; Wang and Wan, 2009a, 2009b; Guo et al., 2010; Quéméneur et al., 2010, 2012; Quéméneur, Hamelin, Benomar, et Chapitre V : Couplage fermentation / MEC 199 al., 2011; Quéméneur, Hamelin, Latrille, et al., 2011), Pierra et al. (2013) reported a shift from Clostridiales to Vibrionales as main dominant bacteria in saline environment at pH 8 with an efficient hydrogen production of 0,90 ±0.02 molH2/molGlucose at 75 gNaCl/L. Other studies considered the association of these two processes (Lalaurette et al., 2009; Lu et al., 2009; Wang et al., 2011; Tommasi et al., 2012; Lenin Babu et al., 2013). Tommasi et al. (2012) compared the two following coupling systems: BioH2+CH4 (dark fermentation and methane production) and BioH2+MEC (dark fermentation and H2-producing MEC). The BioH2+MEC system provided better results in terms of energetic conversion with 2.41 molH2/molacetate with the MEC, which would correspond to a theoretical additional conversion rate of 4.82 molH2/molglucose to dark fermentation. In this study, coupling was just simulated with a MEC fed with acetate and was not actually implemented. Other studies report a significant conversion of organic matter into hydrogen close to theoretical estimations, up to 9.95 molH2/molglucose (Lalaurette et al., 2009) and 8.79 molH2/molglucose(Lu et al., 2009). So far, there has been little discussion about microbial aspects of such a coupling. Indeed, in most of the studies dealing with the association of dark fermentation and MEC for hydrogen production, effluent from dark fermentation process are centrifuged and the supernatant used to feed the anodic compartment of the MEC in order to avoid any disturbance of the MEC by fermentative bacteria (Lalaurette et al., 2009; Lu et al., 2009; Wang et al., 2011). This additional process implies increase in energy cost of the coupling. Whereas the experimental conditions change between dark fermentation and MEC (neutral pH, high conductivity, nutrient deprivation phenomenon), which could affect the fermentative bacteria, their introduction in the anodic compartment can also impact the ARB community structure and electrogenic activity. To date, this specific microbial interaction aspect has only recently been investigated (Lenin Babu et al., 2013). Lenin Babu et al. (2013) found the presence of γ-Proteobacteria (50%), Bacilles (25%) and Clostridia (25%) in the anodic compartment after coupling a dark fermenter and a MEC. Identification of Clostridia sp. shows the presence and the survival of fermentative bacteria in the anodic compartment. However, data are missing to better describe the influence of exogenous bacteria from dark fermentation process on microbial communities in terms of population structure and electroactive performances.
MATERIALS AND METHODS
Fermentative biomass was grown and collected from dark fermentation batch experiments at three different pH values: 6, 7 and 8. Then, the potential impact of these biomasses on an anodic biofilm in terms of bacterial community structure and performances was assessed using four different devices as described below. Four bioelectrochemical reactors were operated at pH 7, usual pH in BES (Logan, 2012). One was conducted at pH 7 with no addition of exogenous biomass as a control (RBC), and the three others were carried out with addition of the biomass from the dark fermenter operated at pH 6 (RB6), pH 7 (RB7) or pH 8 (RB8).
SOURCE OF INOCULUM
The seed sediment used for hydrogen production in dark fermenter and biofilm growth in MEC was the same. It was sampled in a lagoon collecting wastewaters from a salt factory (Gruissan, France). The sediments were stored at lab temperature before inoculation. The initial pH of the sediments was 8.5 and the salinity 67.4 gNaCl/L.
BIOMASS COLLECTION FROM HYDROGEN-PRODUCING BATCH TESTS
For each pH condition of biomass formation in batch cultures, hydrogen production experiments were performed in ten different 600 mL glass bottles. About 2.6 g of the seed Chapitre V : Couplage fermentation / MEC 201 sediment was added to the culture medium to obtain a final concentration of 450 mgVS /L (final working volume of 200 mL). The culture medium was composed of 50mM MES (2-(Nmorpholino)ethanesulfonic acid) buffer, 5 g/L glucose and a mineral solution (Rafrafi et al., 2013) (0.5g/L K2HPO4, 2g/L NH4Cl, 0.2g/L Yeast Extract, 55mg/L MgCl2, 6H2O, 7mg/L FeSO4(NH4)2SO46H2O, 1mg/L ZnCl2, 2H2O, 1.2mg/L MnCl2, 4H2O, 0.4mg/L CuSO4,5 H2O, 1.3mg/L CoSO4, 7H2O, 0.1mg/L BO3H3, 1mg/L Mo7O24(NH4)6, 4H2O, 0.05mg/L NiCl2, 6 H2O, 0.01mg/L Na2SeO3, 5 H2O, 60mg/L CaCl2, 2 H2O, 35 g/L NaCl). The initial pH was adjusted to 6, 7 or 8 using NaOH (1M). To ensure anaerobic conditions, each bottle was flushed after inoculation with nitrogen gas for 15 minutes. Then, the bottles were capped with a rubber stopper and incubated at 35°C until they reached the maximum accumulated volume of hydrogen. Biogas production was periodically estimated by measuring the headspace pressure. Biogas composition (CH4, CO2, H2 and N2) was determined using a gas chromatograph (Clarus 580, Perkin Elmer) coupled to Thermal Catharometric Detection (TCD), as described elsewhere (Quéméneur et al., 2012). The biomass was collected and centrifuged at 20,000 g for 30 minutes. Biomass was collected and resuspended in the original mineral medium (with no glucose). 40 mL of this biomass were added to the N-Stat reactor (OD620nm= 16.6±0.8) Aliquots of two-milliliters were collected at the end of each cycle and centrifuged (20,000g, 10 min). Supernatants and pellets were stored at -20°C. Supernatants were used for further chemical analysis and pellets for DNA extraction.
BIO-ELECTROCHEMICAL SYSTEMS (BES)
Medium for BES operation
To be prepared to the coupling, the culture medium was the same as described previously in H2 production batch tests operated for biomass collection, except that glucose as carbon source was replaced by 10 mM of acetate per graphite electrode present in the reactor. Inoculum was added into culture medium (10% v/v for a final working volume of 500mL). To ensure anaerobic conditions, all reactors were flushed with nitrogen gas for 30 minutes after inoculation. Reactors were incubated at 37°C.
Bioelectrochemical arrangement set up
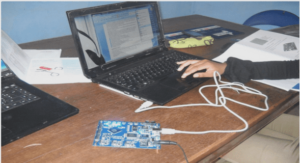
The devices used for the development of bacterial biofilms consisted of an arrangement of 6 electrodes including a reference electrode, a counter electrode and 4 working electrodes. All working electrodes were connected to the same reference and auxiliary electrodes using a multi-channel potentiostat equipped with a NStat system (VMP Bio-Logic SA). The electrodes corresponded to 4 graphite working electrodes (WE) 2.5×2.5×0.2cm (Goodfellow), a platinum Iridium grid (90%/10%) (Heraeus) as a counter electrode (CE) 5x5cm (Goodfellow) and a reference electrode (Saturated Calomel Electrode – SCE). To ensure the electrical connection with the working electrodes, titanium rods of 2 mm diameter and 12 cm long (Goodfellow) were used. The working electrodes were cleaned before use using a P800 sandpaper and rinsed with 99% purity ethanol. The platinum iridium grid cathode/or counter electrode was cleaned by heating in a blue flame. This system was particularly interesting as it permitted the simultaneous development of four identical electroactive biofilms using the four working electrodes as final electron acceptors. To ensure anaerobic conditions, all reactors were flushed with nitrogen gas for 30 minutes after inoculation. Reactors were incubated at 37°C. The anode potential was fixed at +0.2V vs SCE (potential +0.244 vs. SHE). Reactor medium was continuously homogenized thanks to a magnetic stirrer used at a 300 round per minute speed. Figure V-2 presents the N-Stat disposal used to get replicate biofilms on graphite plates. The 4 electrodes were successively removed from the disposal to follow the evolution of biofilm microbial community structure. Current densities (j in A/m²) of the microbial biofilms were calculated considering the total immersed electrode surface area since electroactive biofilms covered both sides of the electrodes with the same microbial community profile (CE-SSCP patterns). Coulombic efficiencies (CE in %) were calculated for each experiment according to Call et al. (2009).

